What Is The Hottest Month In Chania?
July is the hottest month in Chania, Crete, with a mean of 26.7 C in the official HNMS station table. Here is what the full record says about heat, rain and when to go.
July posts a monthly mean temperature of 26.7 C, a mean maximum of 30.7 C and a mean minimum of 21.2 C, with 1 mm of rain across the entire month. August sits just behind it at 26.3 C mean, which makes the closing days of July into the opening days of August the warmest stretch of the Chania year in the record.
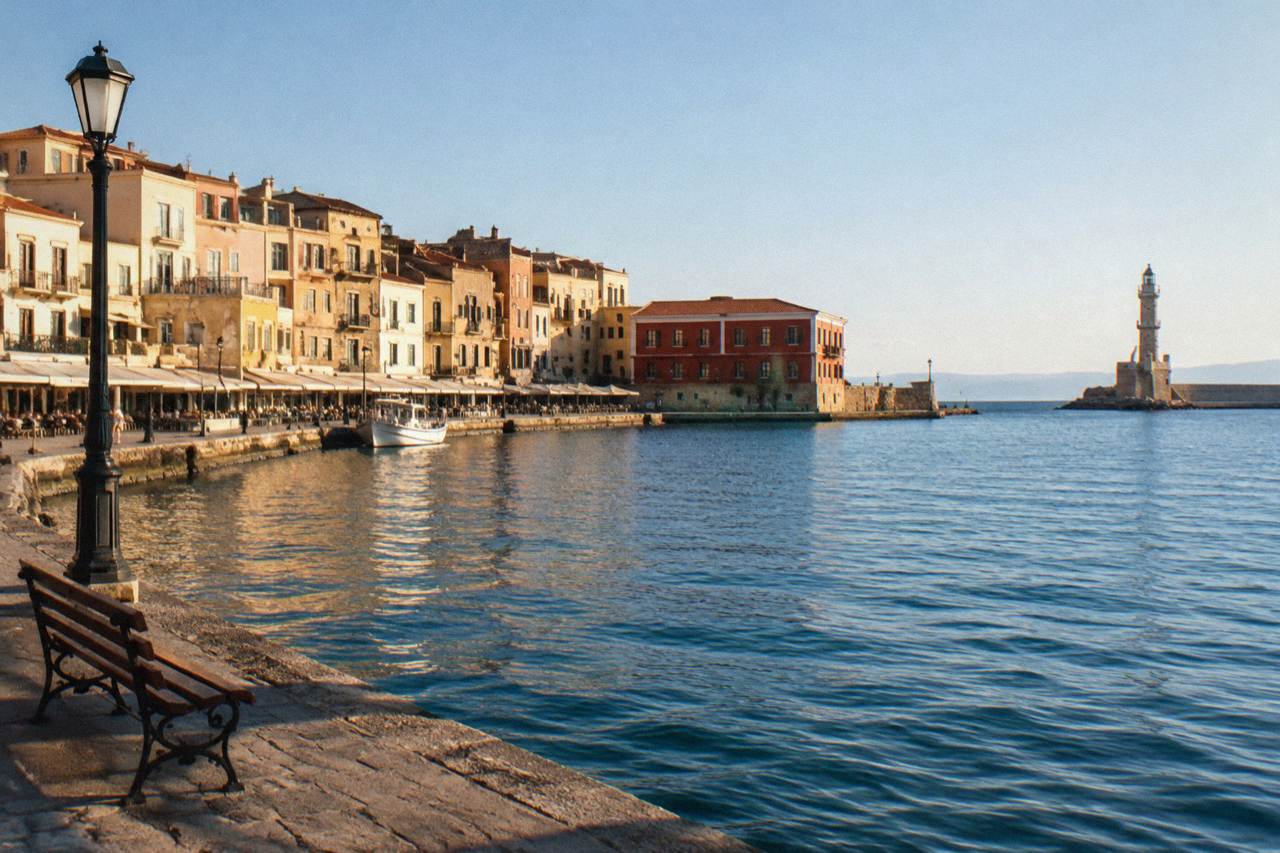
That figure deserves one clarification before anything else. The station that produces it sits at Chania Souda, 148 m above sea level and inland of Souda Bay, so it measures conditions slightly away from the waterfront rather than on the harbour mole itself. The HNMS publishes no newer table, and the period is written honestly as station records 1958 to 2010, not as a 1991 to 2020 normal. Every temperature and rainfall number on this page comes from that one table, and this site prints no monthly sea-temperature normal because none exists as an official series.
What Is The Hottest Month In Chania?
July is the hottest month in Chania by the official station record: a monthly mean of 26.7 C, ahead of August at 26.3 C, June at 24.7 C and September at 23.2 C. The same table gives July a mean maximum of 30.7 C, a mean minimum of 21.2 C, just 1 mm of rain and 0.4 rain days, which is the driest entry in the whole record.
The gap between July and August is small, 0.4 C at the mean, but it holds across the columns. August records a mean maximum of 30.4 C against July's 30.7 C, and the two months tie on mean minimum at 21.2 C. Rainfall is close to nonexistent in both, 1 mm in July and 1.4 mm in August, and rain days sit at 0.4 and 0.6 respectively. In practical terms the table describes one long dry and warm season that runs from late June into early September, with July at its centre.
Humidity moves the opposite way to temperature. The station series runs from 50 percent in July to 73 percent in January, so the warmest month is also the least humid month in the record, a combination shaped by the prevailing wind. The HNMS table lists the prevailing wind as west overall, turning north-west in July and August, which is the general summer pattern known locally as the meltemi; this page gives no wind speeds or dates, because the table does not carry them.
How Hot Does Chania Get Month By Month?
The station table for Chania Souda, covering records from 1958 to 2010, gives mean temperatures rising from 11.0 C in January to the yearly peak of 26.7 C in July, then falling back to 12.7 C in December, with mean maxima peaking at 30.7 C in July and 30.4 C in August. The numbers below are the full official monthly series, not an average invented for this page.
| Month | Mean C | Mean Max C | Mean Min C | Rain mm | Rain Days |
|---|---|---|---|---|---|
| Jan | 11.0 | 14.4 | 7.9 | 129.5 | 16.3 |
| Feb | 11.0 | 14.7 | 7.8 | 104.0 | 14.5 |
| Mar | 12.7 | 16.6 | 9.0 | 76.0 | 11.5 |
| Apr | 15.9 | 20.0 | 11.4 | 31.5 | 7.7 |
| May | 20.2 | 24.5 | 15.0 | 13.5 | 4.2 |
| Jun | 24.7 | 28.9 | 19.0 | 3.4 | 1.2 |
| Jul | 26.7 | 30.7 | 21.2 | 1.0 | 0.4 |
| Aug | 26.3 | 30.4 | 21.2 | 1.4 | 0.6 |
| Sep | 23.2 | 27.4 | 18.7 | 15.4 | 3.2 |
| Oct | 19.4 | 23.5 | 15.7 | 67.7 | 9.3 |
| Nov | 15.8 | 19.6 | 12.4 | 77.0 | 11.2 |
| Dec | 12.7 | 16.2 | 9.7 | 101.9 | 16.1 |
Read as a shape rather than a list, the table shows a fast spring climb and a slow autumn slide. April to June lifts the mean by 8.8 C, while the mirror descent from August to October drops 6.9 C. Rain behaves differently: the dry window is May through September, with 13.5 mm in May, 3.4 mm in June, 1.0 mm in July, 1.4 mm in August and 15.4 mm in September. Rain starts to matter again from October, which records 67.7 mm and 9.3 rain days, and January carries the wettest entry at 129.5 mm across 16.3 rain days.
For anyone weighing a trip against these numbers, the year also delivers about 2,600 hours of sunshine according to the climate summary, and the total precipitation across the twelve months of the table sums to 622.3 mm. That combination, a warm dry summer, a mild wet winter and a short shoulder on each side, is what makes the timing question worth asking at all, and the how many days in Chania is enough question usually follows it.
When Is The Heat Comfortable In Chania, And When Is It Full Summer?
June and September are the shoulder months that flank the July peak: 24.7 C and 23.2 C means respectively, with rainfall still low at 3.4 mm and 15.4 mm. May at 20.2 C and October at 19.4 C sit a step further out, though October carries 67.7 mm of rain and 9.3 rain days, so the table argues for the June and September edges if warm and dry together is the goal.
| Period | Mean C | Rain mm | What The Table Suggests |
|---|---|---|---|
| May | 20.2 | 13.5 | Warm days, cool nights at 15.0 C minimum |
| June | 24.7 | 3.4 | Near-summer heat with almost no rain |
| July | 26.7 | 1.0 | Peak warmth, peak dryness, 0.4 rain days |
| August | 26.3 | 1.4 | Effectively a second July by the record |
| September | 23.2 | 15.4 | Sea-warmed coast cooling slowly |
| October | 19.4 | 67.7 | Mild but rain returns in earnest |
The night-time column matters as much as the daytime one for comfort. July and August share a mean minimum of 21.2 C, June sits at 19.0 C and September at 18.7 C, so the table describes summer nights that stay warm right through the season. Anyone sensitive to heat for sleeping should read that column before choosing dates, and anyone planning hiking should read it twice: the gorge country south of Chania, in the White Mountains, adds elevation to whatever the coastal table says, and this page prints no mountain forecast because none is in the record.
Planning around the July peak also means planning around the sea. A beach day on the south-west corner of the island is one of the classic answers to a hot week, and the Elafonisi beach trip from Chania covers a Natura 2000 protected area where entry is reported to be free and taking sand, shells or plants is prohibited. Check availability if that corner of the coast fits the plan, and the question is it worth going to Elafonisi beach walks through the trade-offs in detail.
Does It Ever Rain In The Chania Summer?
Almost never, by the record: July logs 1 mm of rain over 0.4 rain days and August 1.4 mm over 0.6 rain days, with June at 3.4 mm and September at 15.4 mm. The dry window in the Chania Souda station table runs from May through September, and meaningful rain only returns in October with 67.7 mm across 9.3 rain days.
That October figure is the one that changes plans. From October into the following April the table shows the rain building steadily: 67.7 mm in October, 77.0 mm in November, 101.9 mm in December, the yearly peak of 129.5 mm in January, 104.0 mm in February and 76.0 mm in March, with rain days between 7.7 and 16.3 per month across those months. Winter in Chania is therefore mild rather than cold, 11.0 C mean in January with a mean minimum of 7.9 C, but it is genuinely a wet season by the numbers, and the what not to miss in Chania list is worth pairing with an indoor fallback or two outside the summer window.
How Should You Plan A Trip Around The July Heat?
Build the day backwards from the temperature curve: the station table shows July nights holding a 21.2 C mean minimum and days reaching a 30.7 C mean maximum, so mornings and evenings carry the walking, the waterfront carries the afternoon, and the sea, boat trips and shaded old lanes do the work that midday cannot. The record also says rain will not interrupt the plan, with 0.4 rain days in the month.
Chania's Old Town lends itself to that rhythm. The lanes around the Venetian Harbour, first built 1320 to 1356, hold shade through the middle of the day, and the harbour itself is where the excursion boats leave from, a separate function from Souda port about 7 km east, which handles the overnight Blue Star Ferries crossing to Piraeus. A short sunset cruise is the evening counterweight to a hot afternoon, and the climate crisis resilience fee that accommodation collects per room per night, with seasonal rates confirmed at booking, is the only charge worth remembering that sits outside the weather entirely.
Two practical notes round out a July plan. The meltemi, the general summer north-westerly wind pattern named in the station table, is part of what keeps the peak month at 50 percent humidity, so a breeze on the north coast is normal rather than a surprise. And for anyone stretching the week across the island rather than the city, the things to do in Chania round-up and the what should I not miss in Crete guide both hold options that suit the warm months, from the White Mountains to the Libyan Sea coast.
Common Questions About Heat And Weather In Chania
Is August hotter than July in Chania?
No. In the station table covering 1958 to 2010, July leads on both the mean, 26.7 C against 26.3 C, and the mean maximum, 30.7 C against 30.4 C. The two months tie on mean minimum at 21.2 C, and both are effectively rain-free at 1 mm and 1.4 mm.
What is the warmest month for swimming near Chania?
The table that answers this page is an air-temperature record, and no official monthly sea-temperature normal exists, so this site prints none. Air-wise, August holds a 26.3 C mean after July's 26.7 C, and the sea warms through the summer, so late July into September is when coastal water is at its warmest in practice, with any live reading available on the day described as a live reading only.
Does it rain in July in Chania?
Barely, by the record: 1 mm across the whole month and 0.4 rain days, the driest entry in the table. June logs 3.4 mm and August 1.4 mm, so the May to September window is dry as a rule and rain only returns in earnest in October at 67.7 mm.
Is Chania too hot to visit in summer?
The station table describes a warm but not extreme summer: mean maxima of 30.7 C in July and 30.4 C in August, with 50 percent humidity in July and a prevailing north-westerly wind. Whether that suits a trip depends on the plan, and this Chania Crete Travel Guide page on the warm months exists precisely because the answer is a scheduling question rather than a yes or no.
When does the heat ease off in Chania?
September still holds a 23.2 C mean with a 27.4 C mean maximum, October drops to 19.4 C with 67.7 mm of rain, and November sits at 15.8 C. The descent is steady rather than sudden, which is why September is the shoulder month the table quietly recommends.
The short version: July owns the top of the Chania Souda table, August owns second place by a rounding error, and June and September carry nearly the same warmth with the same dryness and thinner crowds at either edge of the peak.